The reports are already rolling in about Black Friday 2017.
Word is…
- Consumer spending was massive
- Online purchases were popping
- Retailer discounts were steep
But let’s go deeper.
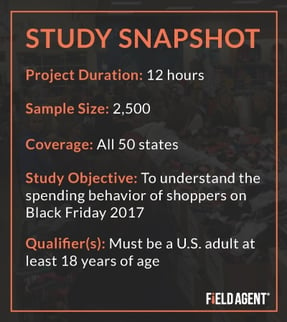
On Saturday, Field Agent surveyed 2,500 U.S. adults* about their Black Friday shopping behavior.
*All U.S. adults at least 18 years of age; all current smartphone owners. Survey was completed on the Field Agent mobile app on Nov. 25, 2017; 67% female/33% male; 18-24 (7%), 25-34 (29%), 35-44 (35%), 45-54 (20%), 55-64 (7%), 65+ (1%).
Below we present several quick facts about the 2017 installment of Black Friday, including which product categories received most of shoppers’ money and attention this year.
Quick Facts: Black Friday 2017
1. How many shoppers actually made gift purchases on Black Friday this year?
Of 2,500 U.S. adults surveyed by Field Agent, 56% said they purchased one or more gifts on Black Friday 2017.
Of those who did not buy gifts (n = 1,098), 27% said they had planned to shop on Black Friday but, for one reason or another, did not. Forty-seven percent said stores are too “crazy” to shop on BF, while 43% said they avoided BF shopping because of the long lines and imposing crowds.
2. How did shoppers make their Black Friday gift purchases?
Among those who bought gifts on Black Friday 2017 (n = 1,402), 73% reported making purchases inside brick-and-mortar stores.
In-store Black Friday shopping is not dead.
Yet, consistent with other reports, online shopping was also big this year. Sixty-one percent said they made one or more gift purchases online this Black Friday, only 12 percentage points behind in-store shopping.
3. On which product categories did shoppers spend the most money and attention?
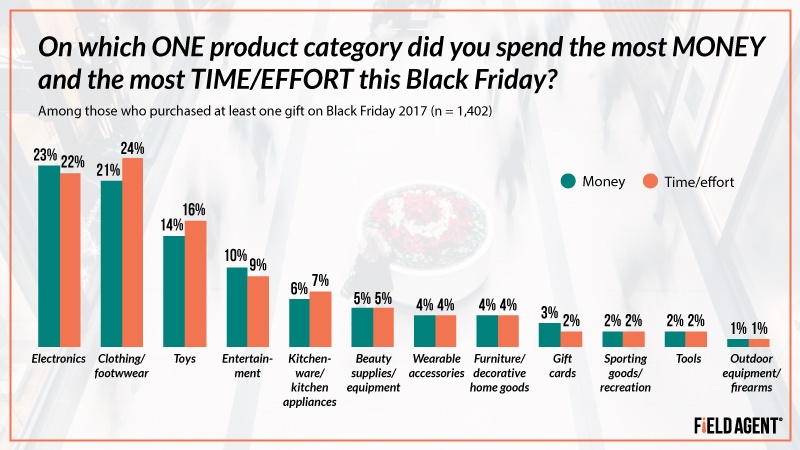
As you can see in the graph below, Black Friday 2017 was a good day for consumer electronics as well as attire.
Of 1,402 shoppers who made purchases on the day, 23% reported spending the most money on electronics, narrowly edging out clothing/footwear. Yet, in terms of time and effort, attire was the top category, followed closely by electronics.

4. How much did shoppers spend on Black Friday 2017?
In Field Agent’s survey, this year, shoppers spent a mean of $226.45 (Mode = $100; Median = $144.50) on a mean of 5.9 different gifts (Mode = 1; Median = 4).
Get More “Quick Facts” on Black Friday & Cyber Monday
Subscribe to the Field Agent blog—Endcaps & Insights—to receive instant notifications when we publish additional facts about Black Friday and Cyber Monday this week.
We'll even examine which retailers were top destinations for in-store and online shoppers.


